
What the Data Really Says Depends on Who’s Asking
Why context and interpretation matter more than we think

This post incorporates and expands on content from one I previously published on Psychology Today.
You can also hear AI Matt’s summary of the piece below.
In Monty Python's 'Argument Clinic,' a customer pays for an argument but receives only contradiction. When he complains, the clerk insists he's delivering exactly what was promised. They're using the same word—”argument”—but they mean entirely different things by it. The result? Total disagreement about whether the service is being properly provided.
Data works much the same way. Take a seemingly straightforward question: Is it more dangerous to live in a big city than in a small town?
Most people assume it’s more dangerous to live in a big city. After all, cities tend to have higher rates of violent crime, and homicides usually make the headlines. So if you’re primarily concerned about murder rates, that definition holds (Anderson, 2022).
But if it were that simple, this would be an awfully short post. If you shift the frame—say, by adding transportation deaths—suddenly rural areas start to look more dangerous overall. Broaden it again to include all external causes of death, and the gap gets even wider1.
Same question. Different frame. Entirely different conclusion.
Of course, I’m not making the case that everyone should move to a major city2. The point of that example isn’t to sell urban living—it’s to show how the conclusions we draw are shaped by the choices we make: which data we use, how we group or weight it, and what we decide to count as relevant. In fact, in this case, the same general data source (Centers for Disease Control and Prevention datasets) could be used to argue that large metropolitan areas are both more and less dangerous than nonmetro areas.
And that’s the broader point. Data never really speaks for itself. It has to be gathered, filtered, organized, analyzed, and interpreted—every step of which involves human decision making. What counts as important? What gets left out? What counts as evidence? These aren’t purely technical questions. They’re judgment calls, and they shape the story the data ends up telling.
Operational Definitions: The Hidden Engine of Every Argument
Before we can even analyze data, we have to decide what we’re trying to measure. And that’s where things get fuzzy—because terms like “dangerous” or “effective” or “better” aren’t self-defining. They have to be operationalized. That is, we have to choose a specific, measurable definition that stands in for the broader concept we care about—a way to determine whether we can classify something as dangerous or effective or to determine which something is more dangerous, more effective, or better than something else.
In the city-vs-rural example, “dangerous” might mean homicide deaths, or it might mean total deaths from external causes3. Neither is wrong—they both provide a way to operationalize how dangerous a place is. But you may end up with wildly different conclusions depending on which definition you choose.
Operational definitions don’t emerge in a vacuum, though. They’re shaped by our psychological context—the beliefs, values, motivations, and prior experiences we bring to any decision situation. This includes what we care about, what our goals are, and what assumptions we bring to the table.
When we define something like “danger,” we’re not just making a technical choice—we’re making a choice shaped by psychological context. That includes our values, but also our beliefs, motivations, and prior experiences. Are we more concerned about homicides or accidental deaths? Do we prioritize short-term risks or long-term health outcomes? The answer often depends on who’s doing the defining—and what lens they’re using in that moment.
Sometimes, it’s values-based biases at play: public safety might evoke concerns about violent crime in one setting and preventable accidents in another, depending on which values are most salient. Other times, belief-based biases shape interpretation—like when someone believes rural life is inherently safer, and unconsciously favors evidence that supports that belief. And often, we see motivated reasoning in action: people interpret or even search for data in ways that support what they already want to conclude.
We can see how these dynamics play out in something as simple—and politically charged—as a mayoral campaign. Let’s say the mayor of a large metropolitan area—call it Metro A—is running for re-election. Her campaign proudly touts a public safety record showing lower overall rates of death due external causes compared to other major cities. According to those numbers, Metro A is safer than comparison cities Metro B and Metro C. That makes for a compelling argument to keep her in office.
But her opponent seizes on a different part of the data. While he doesn’t dispute the aggregate numbers, he points out that Metro A’s lower overall death rate is driven largely by fewer accidental deaths. Its homicide rate, however, is markedly higher. And homicide, he argues, is the real threat to public safety—and a sign the current administration has failed.
Here’s the thing: both candidates are right. They’re just using different operational definitions of “safety,” guided by different values and incentives. The incumbent wants to highlight a favorable aggregate. The challenger wants to spotlight the most emotionally salient threat—and one that suggests a change is needed.
Whose framing wins? That depends on which risks voters care about most—and whether they recognize how much the story changes depending on what gets counted4.
From Data to Decision: Why the Process Matters
Disagreements about what the “data shows” often come down to more than just the data itself. That’s because turning information into conclusions is a process—a series of steps that involve decisions about what to include, how to interpret it, and what it ultimately means. One way to think about that process is through a simple input–throughput–output model (Figure 1).
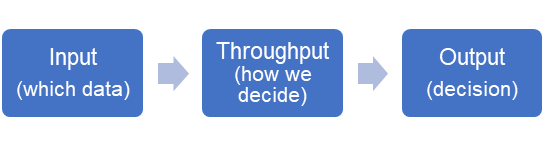
In this model, inputs are the raw materials: the data we gather, the time frames we consider, and the variables we treat as relevant. Throughputs involve what we do with that information—how we analyze it, combine it, compare it, and weigh it against other factors. And outputs are the conclusions we draw or the choices we make at the end of that process.
Change any part of that chain, and you may end up with a very different outcome. The mayoral example is a perfect case in point: different inputs (e.g., focusing on all external causes vs. focusing only on homicides) and different throughputs (e.g., aggregating deaths vs. isolating emotionally salient ones) yield very different conclusions. And neither is necessarily wrong—they just reflect different decisions made along the way.
That’s why psychological context matters so much. It doesn’t just shape how we interpret data—it often influences which data we seek out in the first place, how we choose to organize or transform it, and which conclusions feel valid or justified by the end. Our values, beliefs, motivations, and prior experiences can affect every part of the process. They guide which questions we ask, what we consider relevant, which patterns we notice, and which interpretations we’re willing to accept. In short, psychological context isn’t an add-on—it’s embedded in every step from input to output.
That’s why it’s more accurate to think of data as contextual rather than absolute (Burns, 2024). It doesn’t exist in some pure, objective form waiting to reveal “the truth.” Data only becomes meaningful through the interpretive choices we make—what we include, how we transform it, and what we treat as relevant. And those choices aren’t made in a vacuum. They reflect the interplay between the decision context (the specific decision and context in which it occurs) and the psychological context (the beliefs, values, motivations, and goals we bring to it). It’s that interaction that ultimately shapes how we define the problem—and what conclusions we feel justified in drawing.
So, What Does the Evidence Really Say?
The next time someone claims “the data is clear,” it’s worth pausing to ask a few questions:
Clear according to whom?
Using which definition?
In which context—and with which assumptions in play?
Because evidence doesn’t interpret itself. It only becomes meaningful through the questions we ask, the comparisons we make, and the psychological lens we apply.
Same question. Different frame. Entirely different conclusion.
I should note that finding recent data broken down by rural vs. urban external causes of death was nigh impossible.
While urban life may not be more dangerous in some ways than other population centers, that is certainly not the only criterion we use to decide where to live.
Or it could mean something else.
Assuming, of course, that voters were not overly swayed by their own politically-driven ideological biases, as we see in many elections (Lachat, 2008; Martin, 2022). If they are, then no matter which risk is more relevant to voters, they may vote based on their bias.
Love this! Important read! Context is everything:)
I'm currently working on an AI alignment project where I am trying to make the case that this same truth applies to decision-making. Choices, like data interpretation, are not in the world. Two people with similar values can disagree about what values are even relevant to a given choice, or what the choice even is. And we know this is true because the same person can be influenced to make the opposite choice depending on how things are framed.
So if you want aligned AI, you can't just emulate human values, you have to understand how people come to frame choices in the first place.